Kilowatt.ie lets you modify your load profile using sliders. But when should (and shouldn’t) you use the sliders?
DON’T use the sliders if…
- You’ve already had solar panels for 10 months or more, and uploaded your smart meter data. In this case, your smart meter data already includes solar. Using the solar slider would be adding an extra set of solar panels on top.
- Same for heat pumps/battery storage/EV charger. If you’ve already had the item for 10 months or more, and will be uploading your smart meter data, then it will already be accounted for. Don’t double-count it by using the sliders.
DO use the sliders if…
- Your solar panels/battery/EV charger/heat pump has just been installed (last month or two) or is about to be installed soon
- Or you’re comparing based on the National Average usage
- You want to see the impact of adding extra solar panels/batteries on top of what you already have
What if it’s between 2 and 10 months since installation?
The situation is a bit more complicated if you’ve had your solar/heat pump/EV/battery for about 6 months, and you want to compare using smart meter data.
This is because the comparisons on kilowatt.ie are based on the last 12 months of data. So you’ll have a mix of data with and without the new item.
In this case, you can:
- Select National Average consumption and use the sliders
- Delete the lines in your smart meter data since before the item was installed (and don’t use the sliders)
- Delete the lines in your smart meter data since after the item was installed (and do use the sliders)
- Try several of the above, and choose a tariff that’s a good performer across all the tests
Explaining how the sliders work
When you use the sliders on Kilowatt.ie, the tool adds the item to your electricity usage profile. Take solar panels for example.
Our computer looks up past weather data for the county you selected. Then it calculates how much electricity solar panels would have generated each half hour for a typical year. Then it lays that data on top of your usage profile.
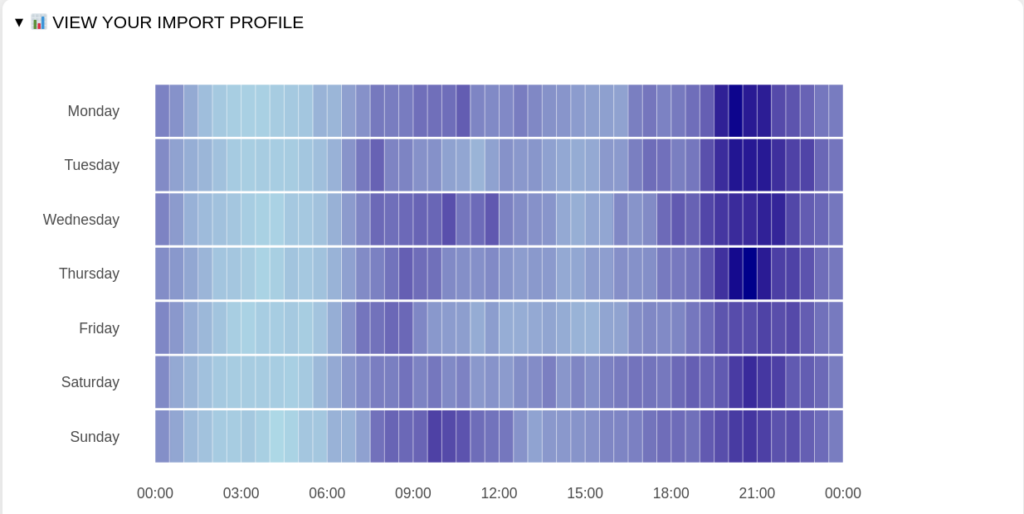
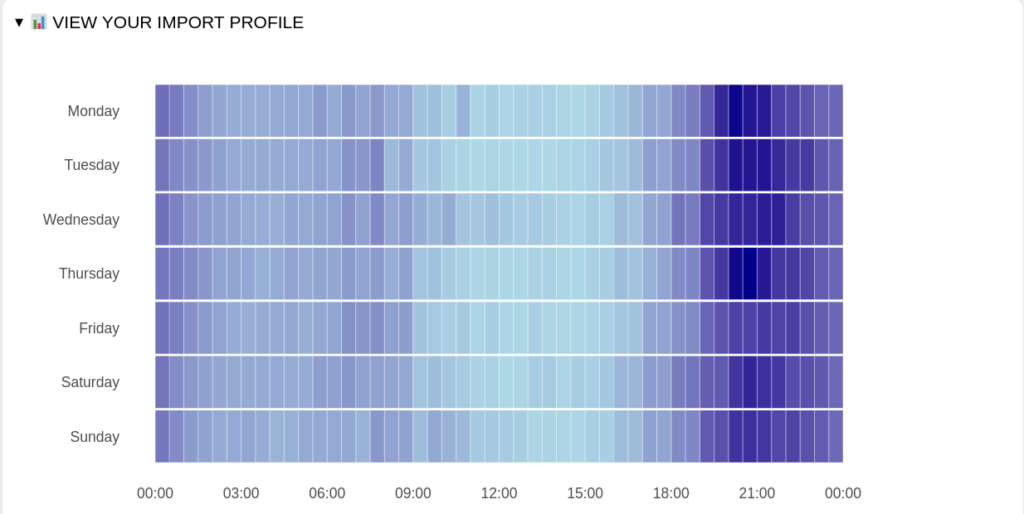
For example, these images show the impact of adding 5kW of solar to some sample smart meter data. Note: The two pictures have different colour scales
Before Solar

After Solar (Simulated)

More Info and Contact
If you’re confused about the sliders, please email me on dominic@kilowatt.ie, and I will do my best to help.
Viewing your smart meter data can help a lot with understanding your usage.
Finally, I’m working hard to improve the site, so your feedback and suggestions are also welcome (also email dominic@kilowatt.ie)